You may have noticed some cool new options in your Podbean stats. We’re bringing you more data and easier comparison tools to help you better understand your podcast’s performance.
The initial period after a podcast is released is a key indicator for both you and sponsors, so we’ve added views of your first 60 day downloads and a chart with first week and month’s download numbers (along with all time). This is also useful when you do promotional activities around new episodes, to see what’s working, which guests or topics get the best response and more. With an easier way to compare episodes over different periods of time, you can see which episodes hold value and continue gaining traction. And, you can quickly view top episodes for any time period as well.
We’re excited to announce these enhancements to the statistics platform:
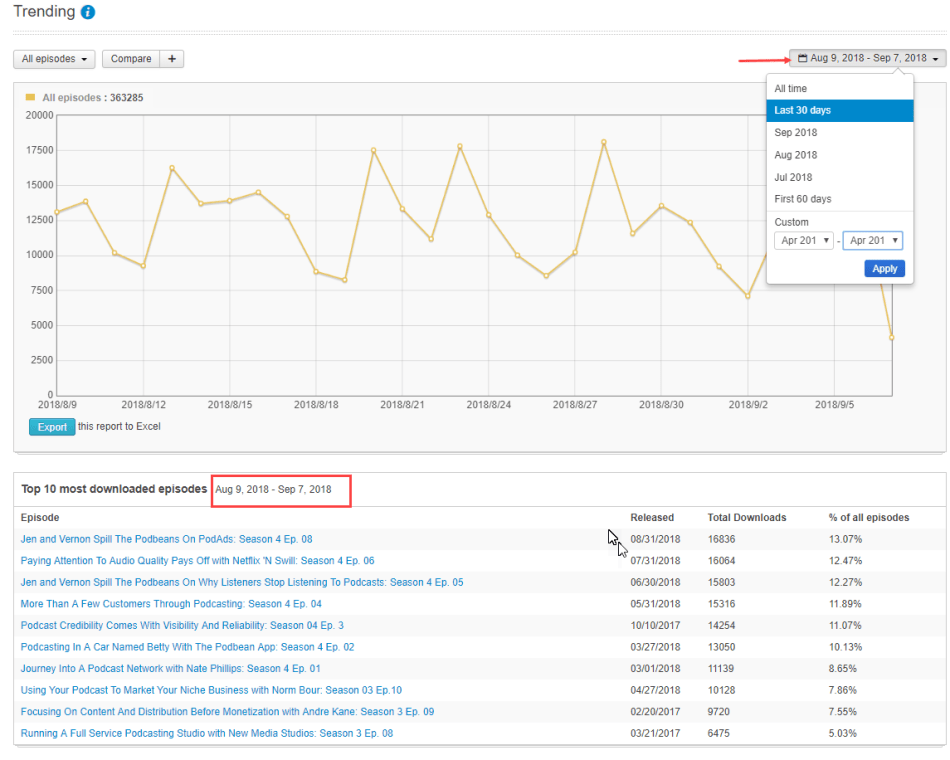
Trending graph
- Compare episode downloads trends for up to 5 episodes in any date range.
- First 60 days downloads trend: see how episodes perform in the critical first 60 days (by episode, all episodes or comparing up to 5 at a time).
Episode downloads quick comparison table
Easily compare key download statistics for the 1st week, 1st month and all time for your episodes

Top 10 Episodes
You can view your Top 10 episodes in any selected date range.
GEO data for Canadian provinces
Now, in addition to U.S. states, you can see the breakdown of your Canada downloads by province.

We hope these additions provide you valuable insights!
As always, if you have questions or would like to share your input on our stats platform, you can contact us at help.podbean.com.
You may have noticed some cool new options in your Podbean stats. We’re bringing you more data and easier comparison tools to help you better understand your podcast’s performance.
The initial period after a podcast is released is a key indicator for both you and sponsors, so we’ve added views of your first 60 day downloads and a chart with first week and month’s download numbers (along with all time). This is also useful when you do promotional activities around new episodes, to see what’s working, which guests or topics get the best response and more. With an easier way to compare episodes over different periods of time, you can see which episodes hold value and continue gaining traction. And, you can quickly view top episodes for any time period as well.
We’re excited to announce these enhancements to the statistics platform:
Trending graph
Episode downloads quick comparison table
Easily compare key download statistics for the 1st week, 1st month and all time for your episodes
Top 10 Episodes
You can view your Top 10 episodes in any selected date range.
GEO data for Canadian provinces
Now, in addition to U.S. states, you can see the breakdown of your Canada downloads by province.
We hope these additions provide you valuable insights!
As always, if you have questions or would like to share your input on our stats platform, you can contact us at help.podbean.com.
Share this: