Understanding your podcast analytics and statistics is pivotal in the growth of your podcast. Your podcast analytics and statistics showcase a variety of points about your podcast’s performance, such as where your audience geolocation, sources of downloads (which apps and sites people are using to play your podcast), what podcast content boosts your podcast traffic, the best timing to release new episodes, how your audience is attracted to and engages with your podcast (retention), and if your content is evergreen (which content does well over time).
We’ve put together a comprehensive breakdown of each piece of data and how you can use it to grow, promote, and track the success of your podcast.
What are key podcast analytics and statistics for a podcast?
Your key podcast analytics and statistics are as follows:
- Podcast downloads
- Downloads for each episode
- Podcast download trends
- Podcast daily listeners
- Geographic downloads data
- Podcast download sources
- Podcast downloads by time of day
- Podcast listener retention
- Top 10 episodes
- Downloads for each episode in the first week
- Downloads for each episode in the first month
Podbean provides you aggregated podcast analytics and statistics. From your podcast statistics dashboard, you’ll be able to discover where your podcasts are being played, such as Spotify, Apple Podcasts, Google Podcasts, and various other apps and environments. All of this play data will be counted and aggregated into Podbean’s podcast analytics and statistics.
This page covers what podcast analytics and statistics you can get from Podbean and how you can use them to continually improve and grow your podcast.
Podbean Statistics and Analytics are IAB Certified
Podbean provides IAB certified podcast analytics and statistics. These guidelines establish a common set of ad metrics for podcasts and a base set of principles that any measurement system should support. This helps to address industry challenges such as lack of uniformity in measurement systems and how metrics are defined. IAB certified analytics and statistics include download, listener and ad delivery metrics.
Podbean provides three levels of podcast analytics and statistics:
- Podcast network analytics and statistics (if applicable)
- Individual podcast analytics and statistics
- Podcast episode analytics and statistics
Podcast Network Analytics and Statistics
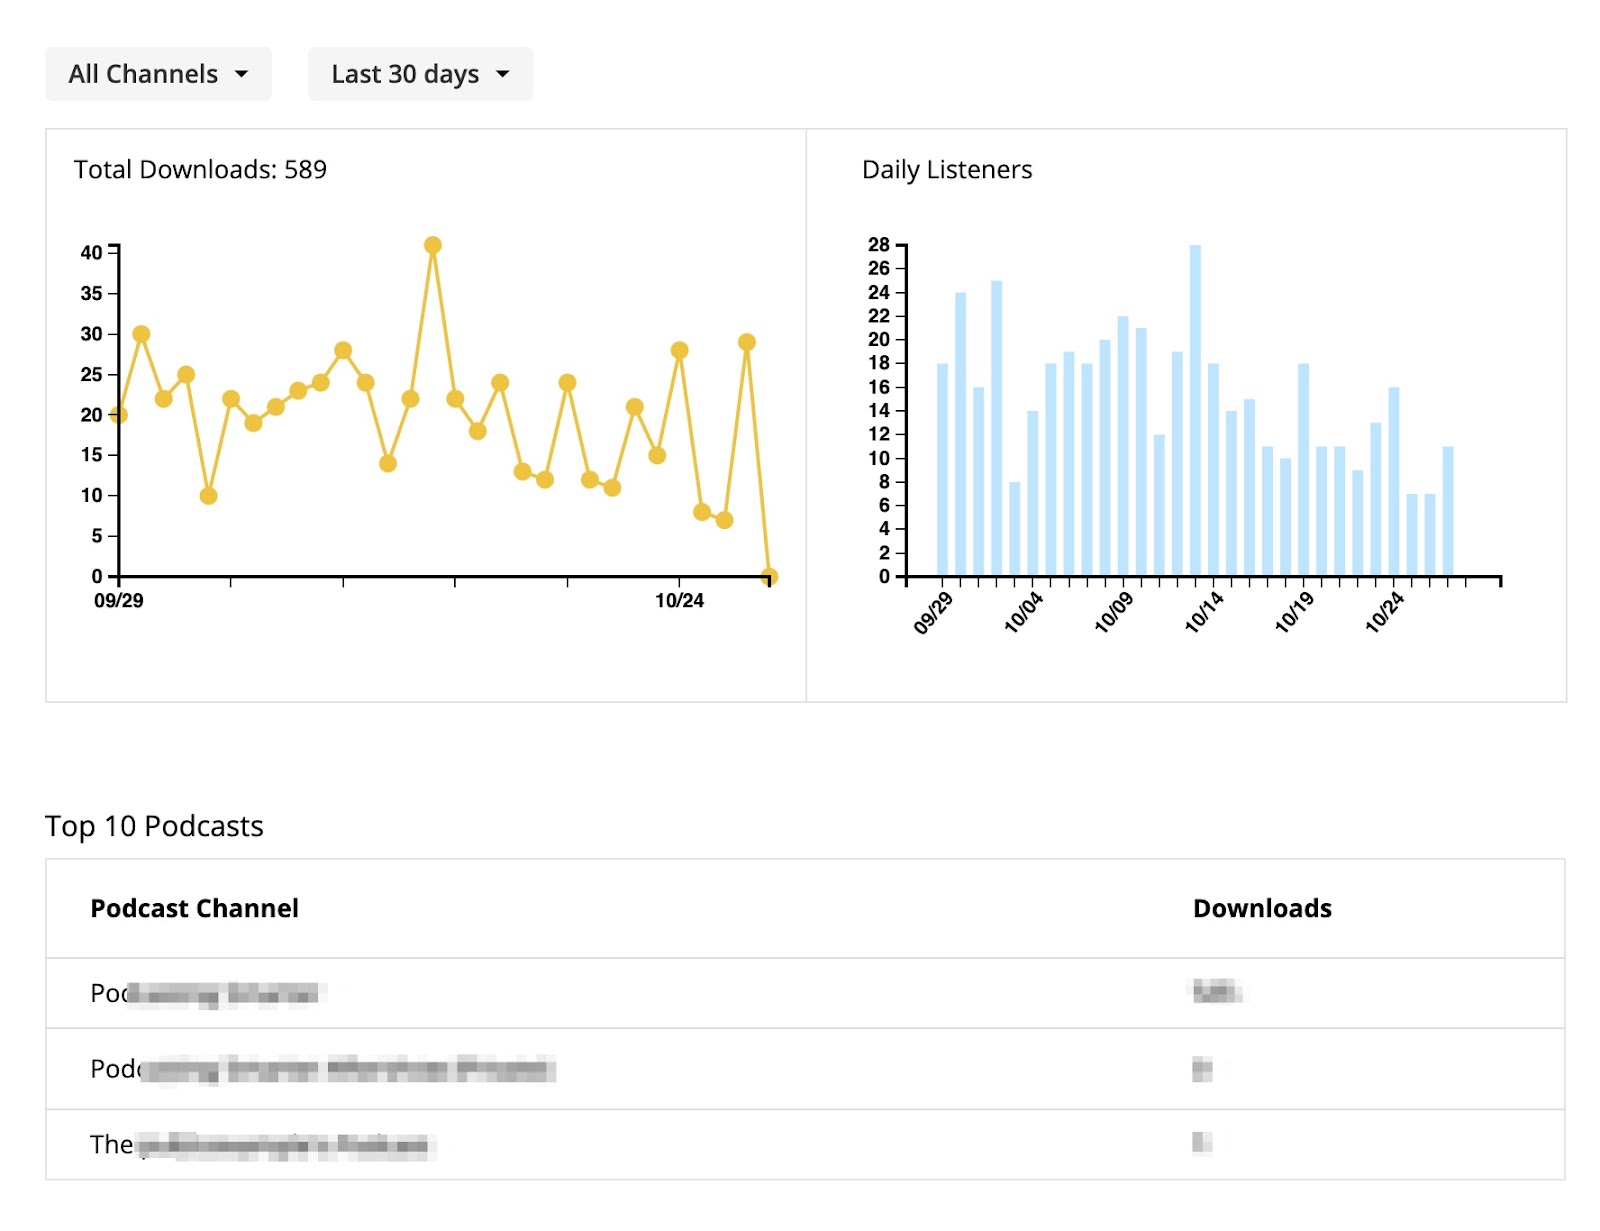
If you have a Business or Enterprise account with Podbean, you can run a podcast network with multiple podcast channels. To help you easily monitor the overall performance of all your podcasts in one place, Podbean provides you the aggregated numbers which sum up all podcast downloads in your podcast network. Aggregated daily listeners lets you know your podcast network’s overall audience size. By default, the last 30 days’ analytics and statistics are displayed when you open this section. You can select different date ranges from the drop down menu. The top 10 podcasts in your network will also be listed according to the chosen date range.

Individual Podcast Analytics and Statistics
For each podcast, Podbean provides comprehensive analytics and statistics to let you get insights into your podcast’s performance.
Podcast Downloads Quickview
At the top of your Podcast Analytics and Statistics page, you can review your podcast downloads from yesterday, the last 7 days, the last 30 days and all time.

Podcast Downloads Trend Graph
After the downloads quick view, the next graph highlights the downloads trending pattern for your podcast during the selected date range. On the right side, the trend for that period is summarized with an overall increase or decrease percentage. Additionally, the number of podcast followers, comments and likes on the Podbean Podcast App are shown on the right side of the graph.

Composition of Podcast Episodes in Daily Podcast Downloads
Using the Downloads Trend graph, you can expand each data point (day) to see all of your episode downloads from that day. Thus, if you see a peak on the trend graph, you can check out which episode(s) contributed to this peak. Is it a newly released episode getting a lot of attention? Is a special guest on an episode attracting more downloads? Or perhaps you released an interview, hosted a promotional event, or got some attention online for an episode that day? The downloads trend graph can help you understand what contributes to your podcast’s growth.
Geographic Podcast Analytics and Statistics
By viewing the geographic podcast data, you can see where your audience comes from, i.e. in which parts of the world your podcast has the most fans. This is helpful in addressing your audience and their needs. This graph can also be useful in creating content, inviting guests from certain areas, focusing on the best advertisers and making marketing and other decisions for your podcast.
For the U.S., Canada, and Australia, you can view the downloads for each state or province.

Podcast Downloads by Time of Day
Downloads By Time Of Day is a heatmap in which you can see which times of the day and days of the week have the largest number of downloads. Using this tool, you’ll gain a deeper insight into your listener’s podcast engagement trends. Based on this information, you may want to schedule your new episodes to be released before the peak downloads time to meet your listeners’ preferences, which can enhance your podcast traffic.

Podcast Download Sources
Our Podcast Download Sources shows you what platforms and directories your listeners are using to listen to your podcast, including Apple Podcasts, Spotify, Podbean, Google Podcasts, etc. You can discover which platforms are the most important for your podcast and be sure to pay attention that your podcast gets updated and shown properly in them. It may also help you to make smart decisions about doing podcast promotion on various platforms and apps where you know you get most listeners (or to consider efforts to develop more listeners on new platforms).
If you click “View More”, you can see the full list of download sources.

Top 10 Podcast Episodes
The top 10 podcast episodes section lets you quickly see which episodes get the most downloads in a selected date range. Based on this information, you can understand what content draws the biggest audience for your podcast. This might be related to subject matter, type of guest (or having a guest vs not), or format. You can also change the date range to review any evergreen podcast content that has attracted more downloads over time.

Podcast User Retention
Podbean Podcast User Retention gives you a picture of listener loyalty from those who are using the Podbean iOS and Android app. This chart shows the number of listeners each week and the percentage retained over the most recent seven weeks.
Here’s an example to help you understand user retention:
From the screenshot below, at Week 1 (Nov 26 – Dec 02), you have 11 listeners. At Week 3 from Nov 26 – Dec 02, 4 of the 11 listeners played your podcast, so the retention rate for Week 3 is 36%.

Podcast Daily Listeners
Podcast Daily Listeners shows you the number of daily unique listeners. This means if a user listens to multiple episodes in a day or plays your podcast multiple times, you will see multiple downloads, but only one unique listener. The daily listeners number gives you an idea of how many people your podcast reached daily.

Podcast Episodes Analytics and Statistics
Podcast Episode Downloads Trend Chart
Podbean podcast episode analytics and statistics shows you the downloads trending pattern for one episode, as well as lets you compare five episodes’ downloads for the selected date range.

The ultimate way to compare your episodes and discover your top-performing episodes:
To find your best performing (most popular) episodes, you can compare episodes in a date range such as in the last 30 days or 12 months. Does the most downloaded episodes in the last 30 days or 12 months mean it’s your all time best episode? Maybe not. If you have an episode published 11 months ago and another one just published 30 days ago, the former episode might have more downloads than the latter one in the 12 month date range, but fewer downloads in the 30 days range. So this type of comparison may not indicate which one is more popular.
Podbean provides you the best way to compare your episodes for this type of analysis. We show you the first week, first month and all time downloads numbers of each episode line by line. So whenever the episode was published, you can compare your episodes for the time period they’re published in a week or a month, which are the periods that tend to contribute the most downloads for each episode. In this way, you can clearly see which episode is the most popular and identify top-performing content. Additionally, if you see the 1st week and 1st month downloads increase when you compare episodes published this year with the ones published last year, it indicates you have more followers and loyal listeners who are consuming your podcast.

Podcast Engagement Intel
If you use a Podbean Business or Enterprise plan, you can get Podcast Engagement Intel in addition to all the other podcast analytics and statistics. Engagement Intel shows consumption data for more in-depth analysis of content and user behavior with the podcast.
Aggregated Podcast User Engagement Intel
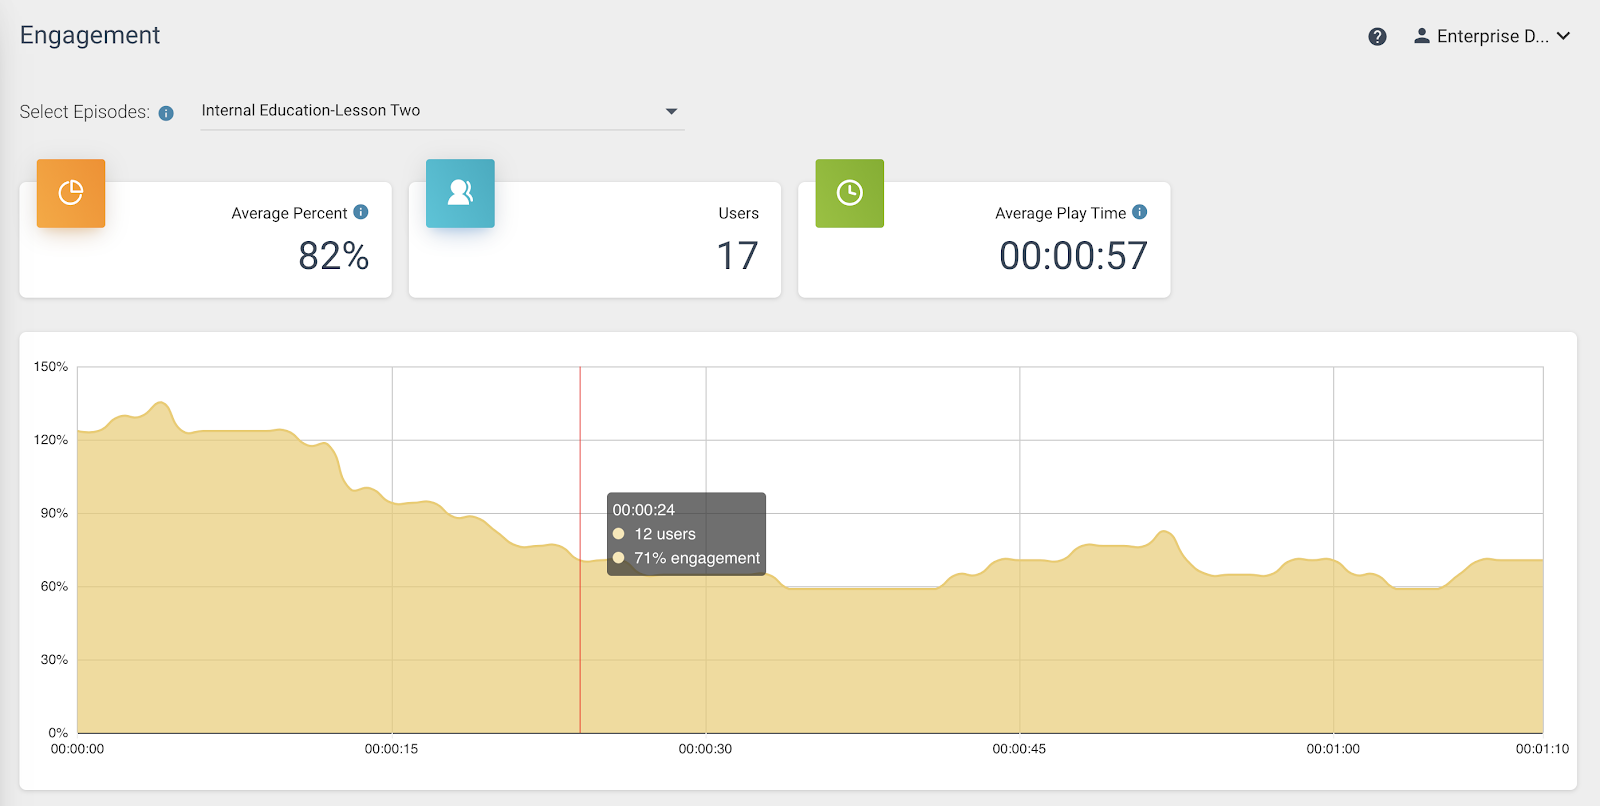
Podbean’s aggregated podcast User Engagement Intel provides you second-by-second listening data. You can know how many users played a particular second in an episode. The engagement intel gives insight into how each episode is being consumed. For example, if you see a section of an episode has a drop in listening rate, you might listen to this section to investigate what might be causing this drop. It could be a distorted sound issue or that the content of the section is not consistent or interesting. You can improve the episode and avoid such pitfalls to keep your audience engaged.
Moreover, from the engagement intel you can understand the average listening time and completion rate of each episode. The longer the listening time and the higher the completion rate, the more attractive your podcast episode is to listeners. Such data can also help you hone length of episodes and see how this relates to specific types of content.
Individual User Engagement Intel in Podbean Private Podcasts
If you use Podbean’s private podcasting service, for example you run an internal training podcast for your company, you can get each individual user’s engagement intel data. Individual engagement intel tells second-by-second play history such as where a user starts playing, stops playing, which parts are skipped or played multiple times and percentage of the episode this user played.
If this is a training podcast, from the individual engagement intel, you will know completion rates for the individual user of their training content and also see which parts of your content could be improved or presented in a different way. For example, if one section shows repeat listening behavior, it might mean the user has a problem understanding it or finds it especially relevant. If a section is skipped by many users, this section might have some issues or the content or format could be less appealing. This can help you identify learning opportunities, analyze how well the podcast(s) are meeting goals, and make continuous improvements to your program.

Overall, podcast analytics and statistics help you understand your audience better and know what podcast content delivers the desired results. By using the variety of podcast analytic and statistical tools, you’ll be able to consistently create engaging content to attract listeners to listen to your podcast, review the results of your uploads, and make changes to create the best content for your podcast.
If you think any other podcast analytics and statistics information might be useful, please feel free to contact us at contact@podbean.com.
I am very very grateful for all of the content being created on this page in the last month. There is not very much out there.
Absolutely! Podcast analytics and statistics provide invaluable insights for podcasters to understand their audience and improve their content strategy.